Cryptocurrency prices have done modestly well in the past few months, outperforming top assets like stocks and commodities. Bitcoin price has jumped to over $42,000, helping push the total market valuation of all digital currencies to over $1.6 trillion. Some of the other top-performing cryptos are Aurora, IoTeX, and Big Time.
Hedera Hashgraph price analysis
Hedera Hashgraph (HBAR) is widely viewed as a leading contender in the fast-growing layer-1 industry. It is a leading chain, which counts several big companies like Google, IBM, Tata, Abrdn, and Dell as members of its governance council.
Hedera Hashgraph’s goal is to be the main blockchain standard for enterprises. For example, its Stablecoin Studiogives companies all tools they need to launch their stablecoins. Some of the features are its KYC and the technology that is needed. It also has faster speeds and low transaction costs.
According to its website, Hedera Hashgraph has over 3.7 million mainnet accounts and has helped to handle over 97 million transactions in the past 24 hours.
HBAR price has not done well during this bull run. The token jumped to a high of $0.065, which was 82% above the lowest point in January. While Bitcoin is hovering at the highest point in more than 18 months, HBAR price is 35% below the highest point this year.
The main reason for this is that Hedera’s ecosystem has been quite muted of late. The only part of its ecosystem that is gaining traction is Pangolin, a leading DEX in the platform.
On the positive side, Hedera Hashgraph price has formed a double-bottom pattern at $0.045. In price action, this is one of the most bullish signs in the market. It has also formed a golden cross pattern, which leads to more upside.
Therefore, there is a likelihood that HBAR price will bounce back soon. If this happens, the key psychological level to watch will be at $0.098, the highest swing on February 12th.
HBAR price chart
Jasmy price forecast
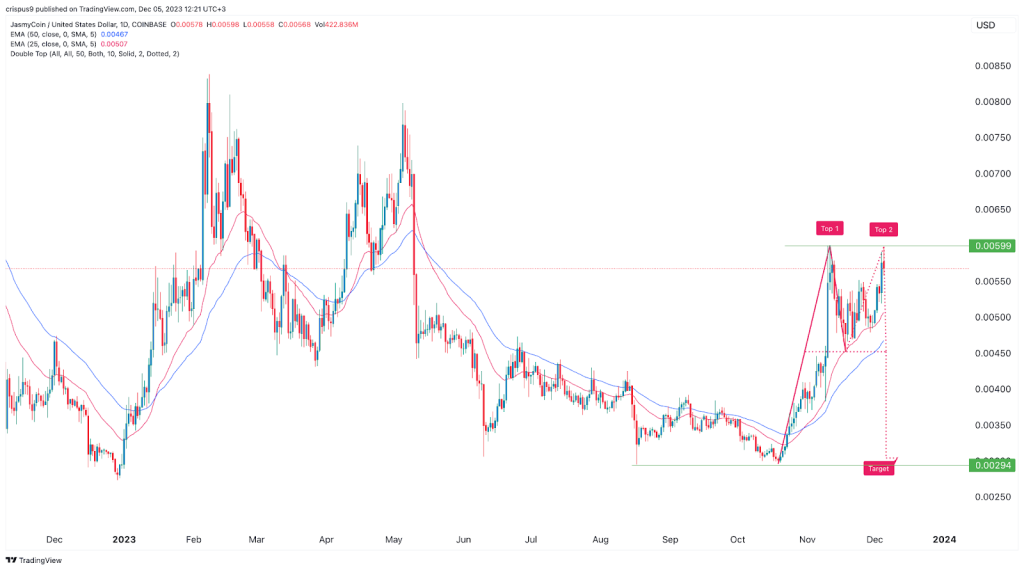
JasmyCoin price has been in a bullish trend in the past few months as demand rises. It bottomed at $0.0030 in October, where it formed a double-bottom pattern. The coin has moved above the 50-day and 25-day Exponential Moving Averages (EMA), which is a bullish sign.
Most notably, Jasmy seems to be forming a double-top pattern, which is a dangerous sign. If this pattern works, it means that the coin will soon have a bearish breakout that could see it move to the key support at $0.030.

Jasmy chart by TradingView
The post Hedera Hashgraph (HBAR) forms a golden cross, Jasmy price double tops appeared first on Invezz
Read the full article here


Discussion about this post